

dBproject - Acoustic and Vibrations
Noise and vibration surveys, intensimetric measurements, acoustic beamforming, simulation models, acoustic quality of rooms, design of mitigation works
Vibro Acoustic Measurements
ISO 10816 - ISO 374x - ISO 9414
Acoustic intensity is a sound measurement technique able to identify the intensity in a point, the direction of origin and its characteristic at the various frequencies.
This technology finds application in every area of Acoustics, to obtain accurate information, product development and detection of anomalies and critical points.
The acoustic measurements for the determination of the sound power level can be performed by measuring the acoustic pressure with a noise source placed on a reflecting plane in a free field, according to the methods indicated by the ISO 3744 and ISO 3746 standards, or with the use of acoustic intensimetry techniques according to ISO 9614 methods.
The measurement of acoustic intensity, with intensity probes and special dual-channel analyzers, permit to measure the sound power even in conditions of high background noise, a frequent condition in industrial environments and in plants.
Quality Room Acoustic Evaluation
STI - STIPA - STITEL
The quality of the acoustic response of a room can be quantified by the measurement of speech intelligibility according to IEC 60268-16; it provides the measurement of the STI, STIPA and STITEL indices, with two methods:
- the DIRECT one, which uses modulated test signals; it is based on a complex signal made up of a set of 98 combinations (14 modulation frequencies x 7 frequency bands). The method associates the characteristics of the environment with the transfer function of the signal which is modified by the emissive characteristics of the amplification and sound diffusion chain and by the acoustic characteristics of the environment (reverberation time and signal/noise ratio).
- the INDIRECT one, based on the impulse response of the environment, applying the Schroeder equation.
The indices are based on the concept of modulation of a carrier, which simulates speech; they range from 0 to 1, where the value 1 equals a “perfect” transmission channel which does not implies any modulation reduction.
STIPA (Speech Transmission Index Public Address) is a simplified form of STI, based on measurements that use less modulation indices.
Noise Source Localization
LEST’S LOOK THE NOISE WITH BEAMFORMING TECHNIQUE!
The Beamforming technique allows to obtain quickly an acoustic map of the area superimposed on its photographic image.
Thanks to the type of representation offered by this technique, it is therefore possible to 'see' the directions of origin of the noise, and then proceed with the identification of the sound sources present in the studied environment, quickly and effectively.
The technique makes use of an array composed of 40 MEMS microphones and a 5 Mpixel optical chamber, opportunetly arranged on a rectangular plate; the sampling frequency of the acoustic signal is 50 kHz, and the visual one is 30 frames/s.
The software (developed and maintained by OPTINAV) implements the algorithm called "Quantitative Beamforming", known for the peculiarities of resolution, dynamic range and precision of the results.
The acoustic maps generated by the system can be calculated both in normalized bands with fixed percentage and in bands with fixed width.
The system is also able to produce dynamic acoustic maps, that capture the evolution of the noise emitted by complex machinery produced by kinematic mechanisms and other noise sources such as valves, vents, transport systems...
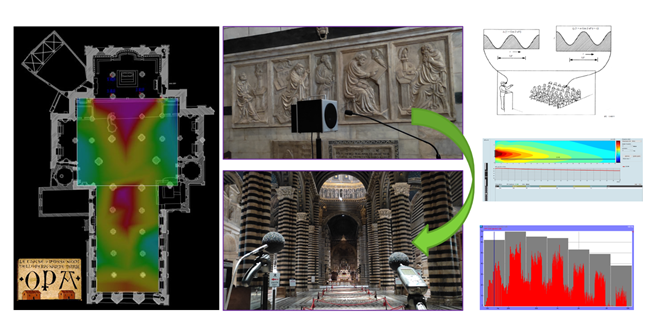
Room Acoustic Prediction
Industrial room - theater - audiTorium
The prediction of the acoustic quality of environments is successfully dealt with the numerical techniques of geometric acoustics; it ignores the wave nature of the acoustic phenomenon, which is instead treated as an optical phenomenon, in which the noise sources emit energy (acoustic rays) into the surrounding space.
The sound field is determined by considering the path and ulterior reflections of the rays on the walls that make up the domain of study .
The progressively loss of energy of the rays is due to various effects: geometric divergence, absorption by the walls, dissipation in the propagation medium.
The path of the rays is usually determined through a particular procedure, a hybrid between the two classic methods of pure Ray Tracing (fast, but not very accurate) and Image Sources (deterministic, but not efficient from a computational point of view).
For frequencies lower than the Schroeder frequency, found in cavity problems and for small rooms, it is necessary to use other approaches that consider the wave nature of the pressure field propagation, for example finite element techniques (FEM) or at the boundary (BEM).
Oil & Gas Noise Study
FPSO - Platform - GAS COMPRESSOR STATION - POWER Station
In the oil & gas sector, is important to predict the noise levels produced by all the machines that compose the items:
- gas turbines
- air intake
- air exhaust ducts
- cabin ventilation ducts
- gear boxes
- compressor train
- generators train
- gas piping
- ...
Noise on platforms, on FPSO, in gas compression and energy production station must be kept under control, especially to limit the exposure of workers.
The evaluation and estimation of the noise levels of these plants is carried out through calclutation models with adequate level of details.
Acoustic radiation models, based on geometric acoustic algorithms, can be used to evaluate the coverage and intelligibility of danger and alarm signals.
Assessment Noise Impact
Industrial settlements - transport infrasctructures
Acoustic impact assessment studies the induced effects and changes in conditions preexisting noise in a given portion of the territory due to the addition of new infrastructures, industrial plants, activities or events in general.
The acoustic impact documentation must provide the elements necessary to predict the acoustic effects due to the plant and its operation by evaluating the sound sources, the noise activities, the study area and the nearby living spaces.
It can also be requested as part of a Single Environmental Authorization (AUA) or Integrated Environmental Authorization (IEA) procedure, also in forecast form (before the construction of the plant).
In Italy, this study is governed by the "Legge Quadro" on noise pollulation n. 447 of 26 October 1995 and regards all productive activities and public establishments that have noisy machinery.
Recent international technical standards implement calculation methodologies that allow noise levels to be predicted.
Modal Analysis and Experimental text
hammer test dynamic properties of mechanical systems in the frequencies domain
In the development stages, simulation and analytical forecasting through finite element numerical models they can provide indications about the proper modes of vibration of structures, mechanical parts, machine elements...
But simulation is not enough. It is often necessary to perform physical tests on prototypes in order to validate the results of the simulations.
The vibration frequencies and the related modes of vibration predicted by the FEA models can be validated by specific experimental tests, called hammer tests. These tests help manufacturers ensure the quality, reliability and durability of complete products and their components by providing insights into the internal world of vibrations within products, machines and facilities.
Typically, test modes are of 2 kinds.
- Roving Hammer: the accelerometers are fixed at the points of interest, the hammer moves and impacts at different points with different directions.
- Roving Accelerometer: the point and direction of impact is defined; the accelerometers are arranged and moved to points of interest.
Speech Transmission Quality Test
STI AND STIPA MEASUREMENTS
The measurement of the Signal (direct method) is carried out in different measurement positions evenly distributed inside the room.
The generation of the normalized signal STI(PA), with the TalkBox, is regulated to produce the adeguate frequency modulated signal with an equivalent sound pressure level at 1.0 m in free field equal to 60 or 70 dBA.
In each measurement position, at least 3 measurements of the speech intelligibility evaluation index STI(PA) are performed, with an integration time of 30 seconds. To verify the Signal/Noise ratio, the background noise is also measured with an integration time of 60 seconds.
At the end of the measurement in each station, the average value of the evaluation index was processed, allowing control of quality trasmission of vocale message.
Classrooms Acoustic Testing
REVERBERATION TIME AND SPEECH TRANSMISSION INDEX
Recent legislations require the verification of acoustic quality within classrooms, expressed in terms of Statistical Reverberation Time (T) and Speech Transmission Index (STI).
The presence of the reverberated sound field is useful for listening purposes because its contribution improves the sound energy density value; however, an excessive value worsens the listening quality with loss of signal intelligibility.
Therefore, the reverberation time T assumes, in relation to the listening conditions, an optimal value to offer the best compromise for the influence of the reverberated sound field on listening quality.
It can be measured by acoustically exciting the environment with a piece of equipment called a "clappatore" ( the English term 'to clap').
As the vocal message propagates within an environment, it deteriorates due to successive reflections on the surfaces that delimit the environment and the level of background noise; this deterioration corresponds to a reduction in modulation depth in one or more modulation frequencies.
According to IEC EN 60268-16, STI is a dimensionless number related to the judgement of speech message comprehension; its value represents the probability that syllables, words and sentences are understood adequately.